
Equity Research India
Noida

The week ended on 12th April 2024 was not what traders or investors would have wanted to.
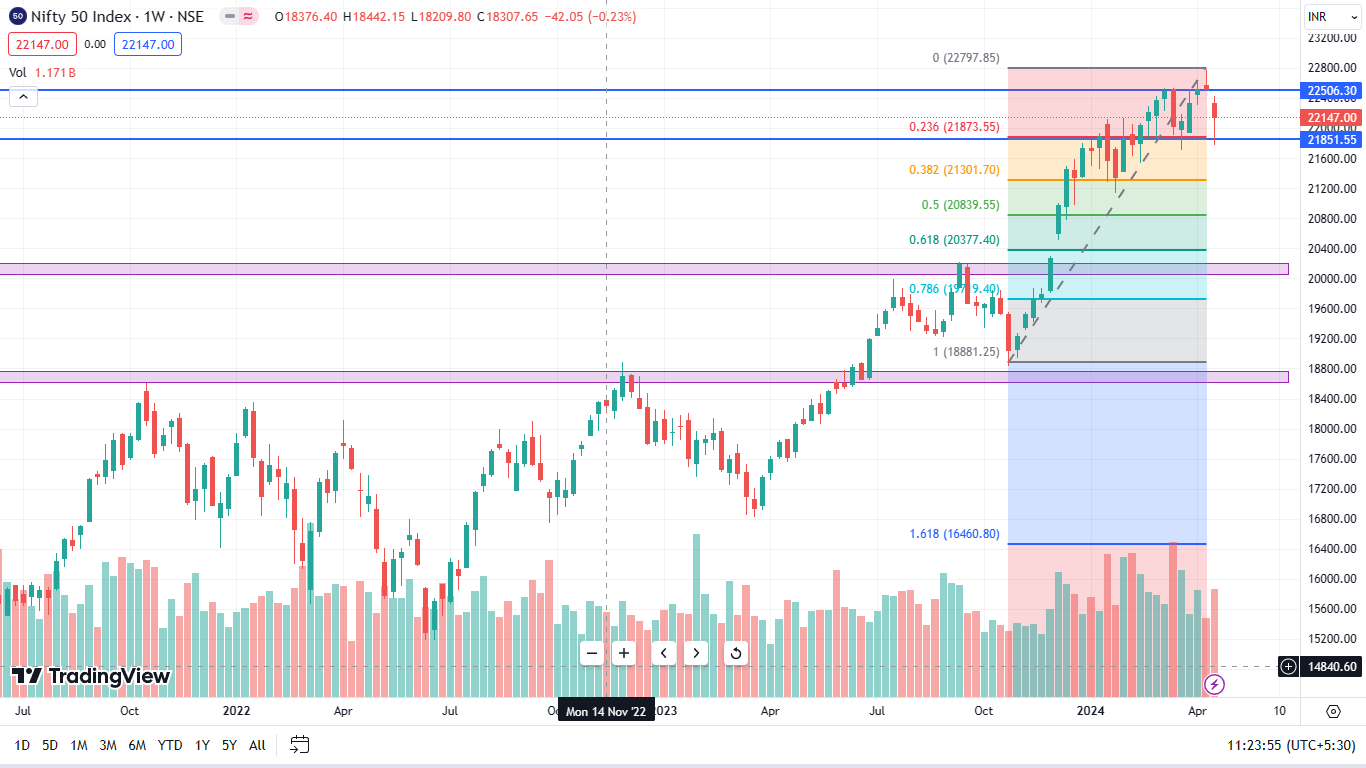
NIFTY 50 closed with red candle giving hint of trend reversal on weekly charts.
The candle formed resembles shooting star candlestick pattern which is formed after a bull rally and has long wick and small body as seen in chart below. Number of instances wherein similar candle stick pattern was formed has been number marked in CHART of SUPPORT & CHANNEL below.

As per weekly char of Nifty 50 , Fibonacci retracement indicates next support at 21800- 22000 level.

Though the nifty 50 had given the breakout of the channel its was trading since June 2022, the upper line of channel was acting as support for last few weeks and hence NIFTY 50 remained above that channel.
However, formation of bearish candle at the top and negative global cues may lead to bearish trend for short term.

The week ending on 19th April experienced significant pressure on the equity market due to prevailing tensions in the Middle East region. Nifty which indicated for some correction on weekly…
...