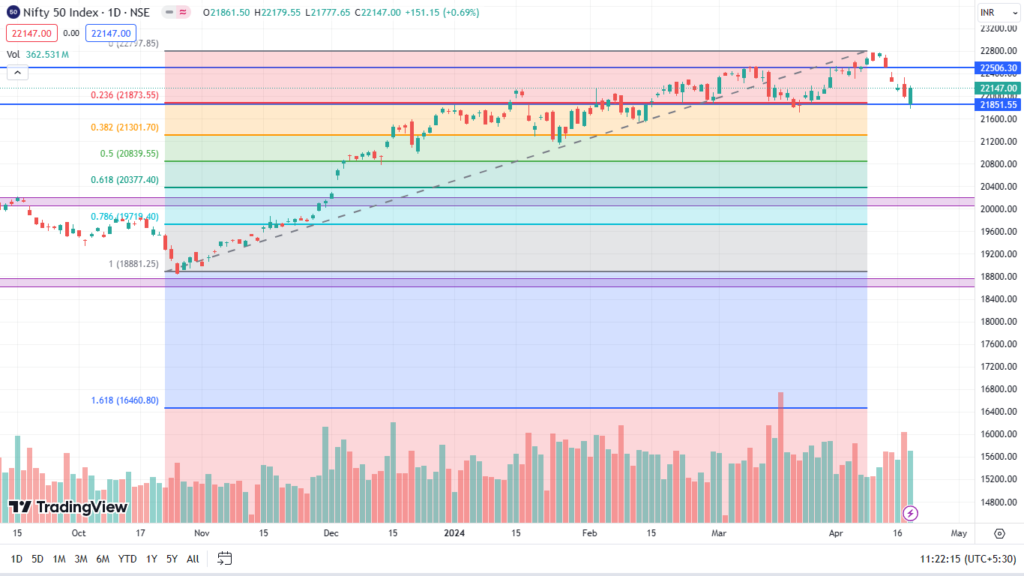
The week ending on 19th April experienced significant pressure on the equity market due to prevailing tensions in the Middle East region.
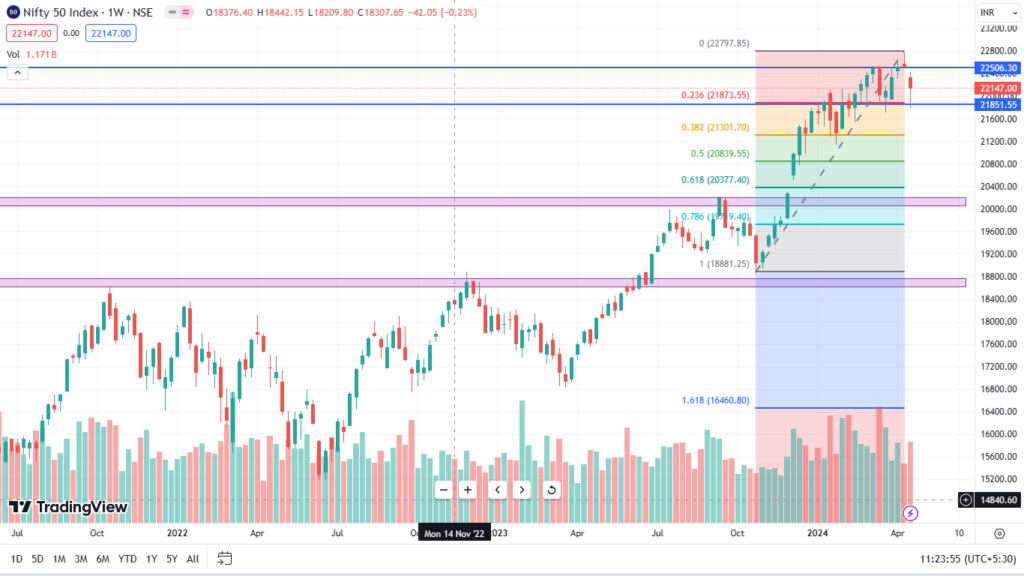
Nifty which indicated for some correction on weekly chart of previous week was captured by our team in our weekly analysis of nifty and resistance and supports were clearly demarked.
The nifty respected its support @ 21800 and shown some buying interest at this level as we can see on Daily chart.
On weekly chart, NIFTY shows a candle resembling to trend reversal candlt having long wick and small body which suggests buying at the support level of 21800.
Hence weekly chart of NIFTY confirms support and resistance levels for short to medium terms until breakout happens on either sides of resistance and support.
Resistance being at 22500 and support being at 21700-21800.
Traders can keep in mind these levels while initiating trades on either side.
Investors can keep in mind sideways movement may be forthcoming in NIFTY and plan investment accordingly.


